A few years ago I was a forward-deployed engineer at one of the largest online resale marketplaces in the US, the one that mails you a clean-out kit and resells what is inside. We were the second-biggest production deployment of a particular vector database, run by a well-known in-memory database vendor.
We had a latency problem nobody could pin down. P99 on vector queries was around 500ms with a quiet store and roughly 1500ms while the ingestion pipeline was running. Both numbers were well past our search-results budget and visible to end users. The interesting part of this story, looking back, is not the bug. It is that we and our partners responded to the same incident in completely different ways, and the trust outcome at the end was nothing like the trust outcome you would have predicted on day one.
For the first three days I had assumed it was us. Our query construction, our schema, our pool sizing, our serialisation. The vendor’s replies kept reinforcing that assumption without ever quite saying it outright. Every “can you send another trace” carries an implicit “you are probably holding it wrong.” I am a bit embarrassed by how long I held that assumption. It only broke on day 4 when the schema rewrite cut latency by more than I could explain from the schema alone. A pure schema problem should not have left the residue I was seeing. That gap was the first concrete reason to stop trusting their diagnosis and start reading their client code myself.
What the vendor did
Permalink to “What the vendor did”The vendor’s playbook was to buy time. “We are looking into it.” “Our team is investigating.” “Can you send another slowlog dump, an INFO snapshot, an SDK trace from a spike window.” Each update was an update about the process of working on it, not about the work itself. Account managers joined calls. Support tiers were upgraded. An exec escalation came back down to the same engineers who had not figured it out yet, just with a longer cc line.
None of those messages contained a hypothesis. None of them said what had been ruled out. The whole thing was optimised to keep us from churning, not to close the ticket.
What we did instead
Permalink to “What we did instead”I wrote a running incident note and updated it on a fixed cadence. Daily at first, then twice a day once we were close. Every update had the same four lines:
- Current hypothesis. What we now think is happening, in one sentence.
- What we ruled out since the last update. With the evidence, not just the conclusion.
- Next step and owner. One thing, one person, one expected finish time.
- Customer impact right now. Numbers, not adjectives.
A real one from around day 6, sanitised. Shorter than the template, but the four slots are still there:
think it’s their client picking the wrong filter strategy on hybrid queries during ingestion. quiet store is fine since the schema rewrite, ingestion windows still spike to ~150ms occasionally.
I ruled out: pool size (tried 0.5x and 2x, no diff).
Today I will read their hybrid path against our query shape, get a minimal repro by EOD.
p99 is ~12ms quiet / ~52ms during ingestion, was 500/1500.
The note went to our execs, their execs, both support channels, and the engineers who were actually doing the work. Same text to everyone. No separate “exec summary” that softened anything.
The cadence forced two useful behaviours on us. It made it embarrassing to write “still investigating” two updates in a row, so somebody always shipped a ruled-out branch before the next update went out. And it gave the vendor’s engineers something concrete to reply to, instead of a vague “any progress?”.
Partial first, then full
Permalink to “Partial first, then full”We shipped the fix in two visible steps and we announced both of them.
The partial mitigation came on day 4. I had narrowed the spike to a specific query shape, filter plus nearest-neighbour search. The mitigation was on our side, in the index schema. We had fields that were being filtered on but were not actually indexed at all, and fields indexed using a heavyweight type when the queries we ran against them were just equality checks. Numeric fields where we never did range comparisons. Text fields where we never did full-text search. I rebuilt the schema so every filterable field was indexed, and indexed each one as the cheapest type that still satisfied the queries hitting it. The filter step got cheap enough that the vector search on the survivors did not blow the latency budget any more, even with the client still picking the wrong execution strategy underneath.
P99 dropped from ~500ms to ~12ms quiet, and ~52ms during ingestion. I sent an update that said exactly that, in those words. This is a workaround, not a fix. Here is why it works. The underlying client bug is still there. Here is what we are doing next.
We did not wait for the full fix before communicating the partial one, and we did not let the partial one quietly get redescribed as the resolution. Both of those are common and both of them erode trust.
The root cause came on day 9. The bug was in the vendor’s client library. A vector search with a pre-filter has two reasonable execution strategies, roughly “batch the candidates and filter them” or “filter first, then brute-force the survivors”, and the client picked between them automatically. For our cardinality and selectivity it was picking the batched strategy with a default batch size that degenerated to something close to a full scan per query. Forcing the other policy was the right call. I patched their client so the auto-selection accounted for our shape of workload. The patch went upstream. The runtime override in our app was removed in the next release. The closing update had the diff, the benchmark numbers before and after, and a one-line note on what the patch did not fix, so nobody could oversell it.
What the recovery actually told us
Permalink to “What the recovery actually told us”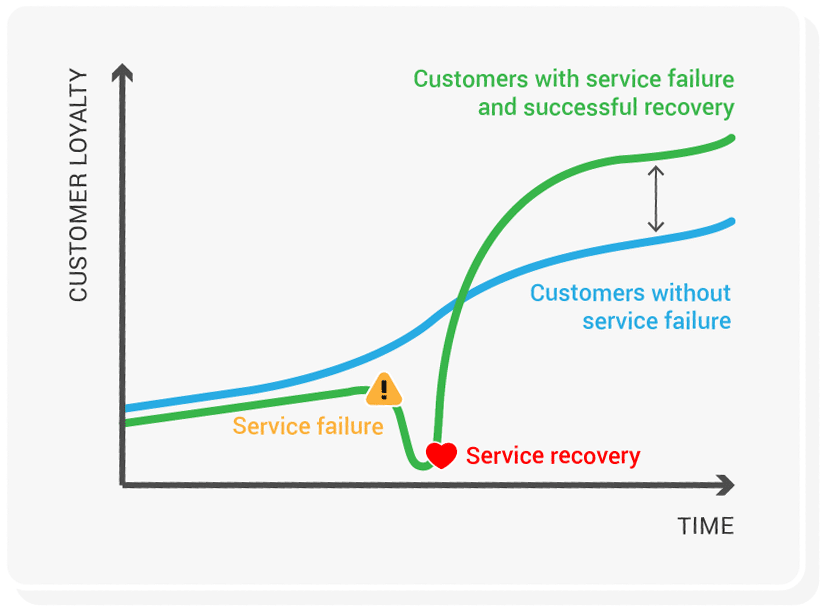
The marketing literature calls this the service recovery paradox: customers can rate you higher after a well-handled failure than if nothing had gone wrong. The effect is real, modest, and conditional. It does not survive a catastrophic outage, a slow response, or being a repeat offender. The meta-analyses are also pretty lukewarm on whether it actually changes repurchase behaviour.
What those meta-analyses miss, I think, because they are measuring NPS, is that recovery is also information, and the information cuts in both directions.
After those nine days I trusted our own incident process more than I had any right to before. I had seen what it produced under pressure rather than just in a runbook. We had used a failure to demonstrate, to ourselves and to a customer, exactly how we behave when nothing on the dashboard is green.
I trusted the vendor less, not more. The fact that the fix turned out to be in their client was almost incidental to that. The signal was nine days of process-about-process replies, an account team built as a moat around the engineers, and an organisation that wanted us to feel attended to instead of being told the truth. The engineers themselves I respected. The company I did not. On later customer projects I steered around them where I could, and where I could not, I architected things so we would never again be the second-biggest deployment of anything they shipped.
That is the version of the paradox I think is worth keeping. Recovery is calibration. It can move trust up or it can move it down. The direction is decided by how the people involved behaved during it, not by who eventually wrote the patch.